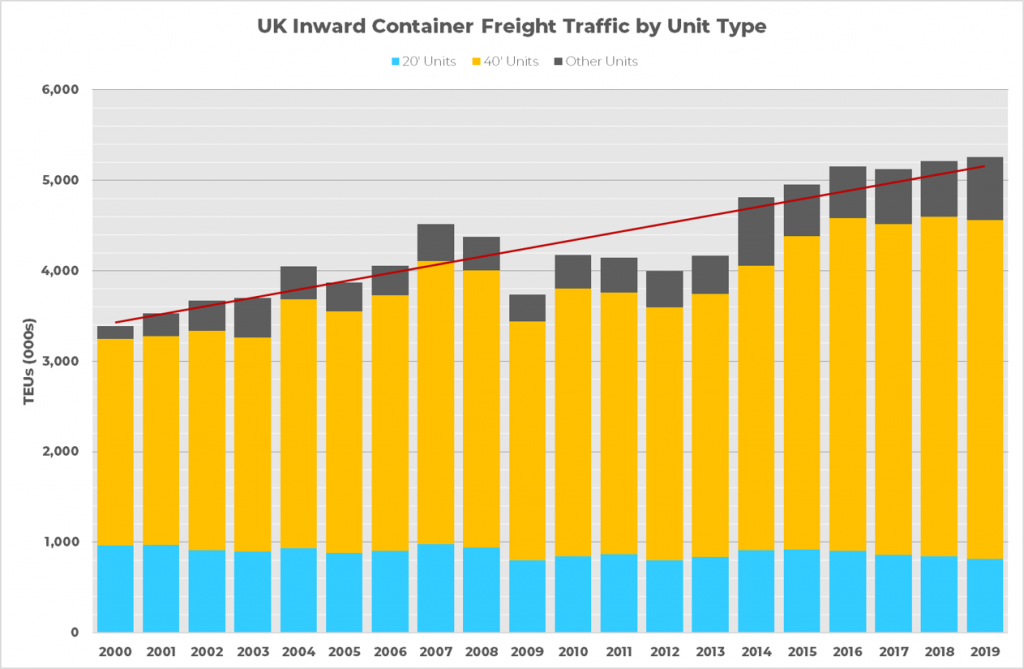
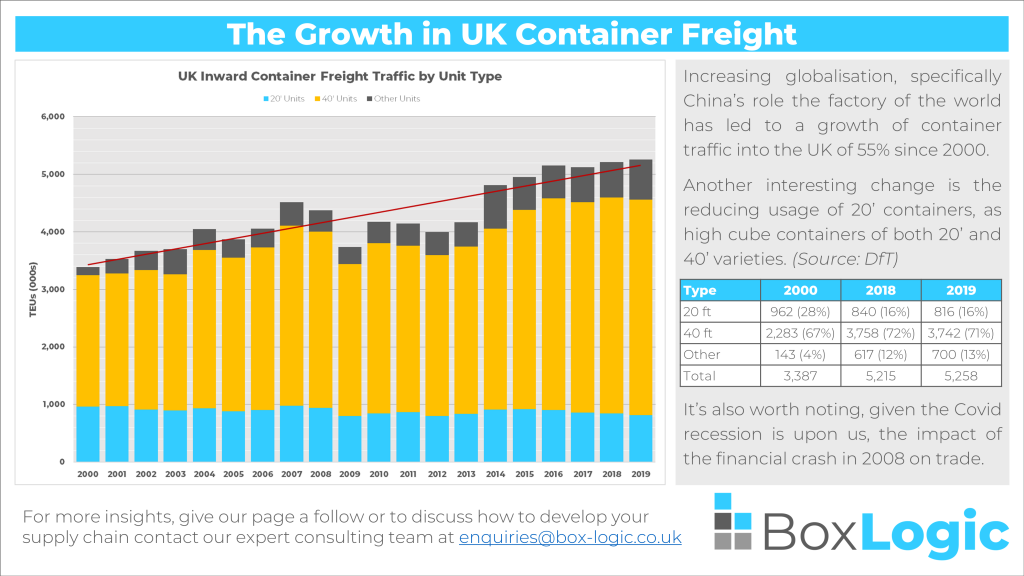
Increasing globalisation, specifically China’s role the factory of the world has led to a growth of container traffic into the UK of 55% since 2000.

Another interesting change is the reducing usage of 20’ containers, as high cube containers of both 20’ and 40’ varieties. This can be seen in the below table, illustrating the TEU (Twenty-foot Equivalent Unit) contribution of each type of container.
Type | 2000 | 2018 | 2019 |
|---|---|---|---|
20 ft | 962 (28%) | 840 (16%) | 816 (16%) |
40 ft | 2,283 (67%) | 3,758 (72%) | 3,742 (71%) |
Other | 143 (4%) | 617 (12%) | 700 (13%) |
Total | 3,387 | 5,215 | 5,258 |
It’s also worth noting, given the Covid recession is upon us, the impact of the financial crash in 2008 on trade. What will this look like in five years time?
For further insights, follow our pages on Twitter and LinkedIn or to discuss how to develop your supply chain operations, contact our expert consulting team on our Contact Us page or email enquiries@box-logic.co.uk


